

Tariffs & cost
Enter your electricity rates in Settings → Tariff and the bridge turns your live grid flow into money.
Set a fallback import rate and a feed-in (export) rate, then add time-of-use windows to override them: a peak window, an off-peak window, a free period (just a window at rate 0). Windows can wrap past midnight and are read in your system's local time. One switch turns the figures on.
What you see
The Home tile splits: consumption on the left, cost on the right. Each half opens its own fullscreen.
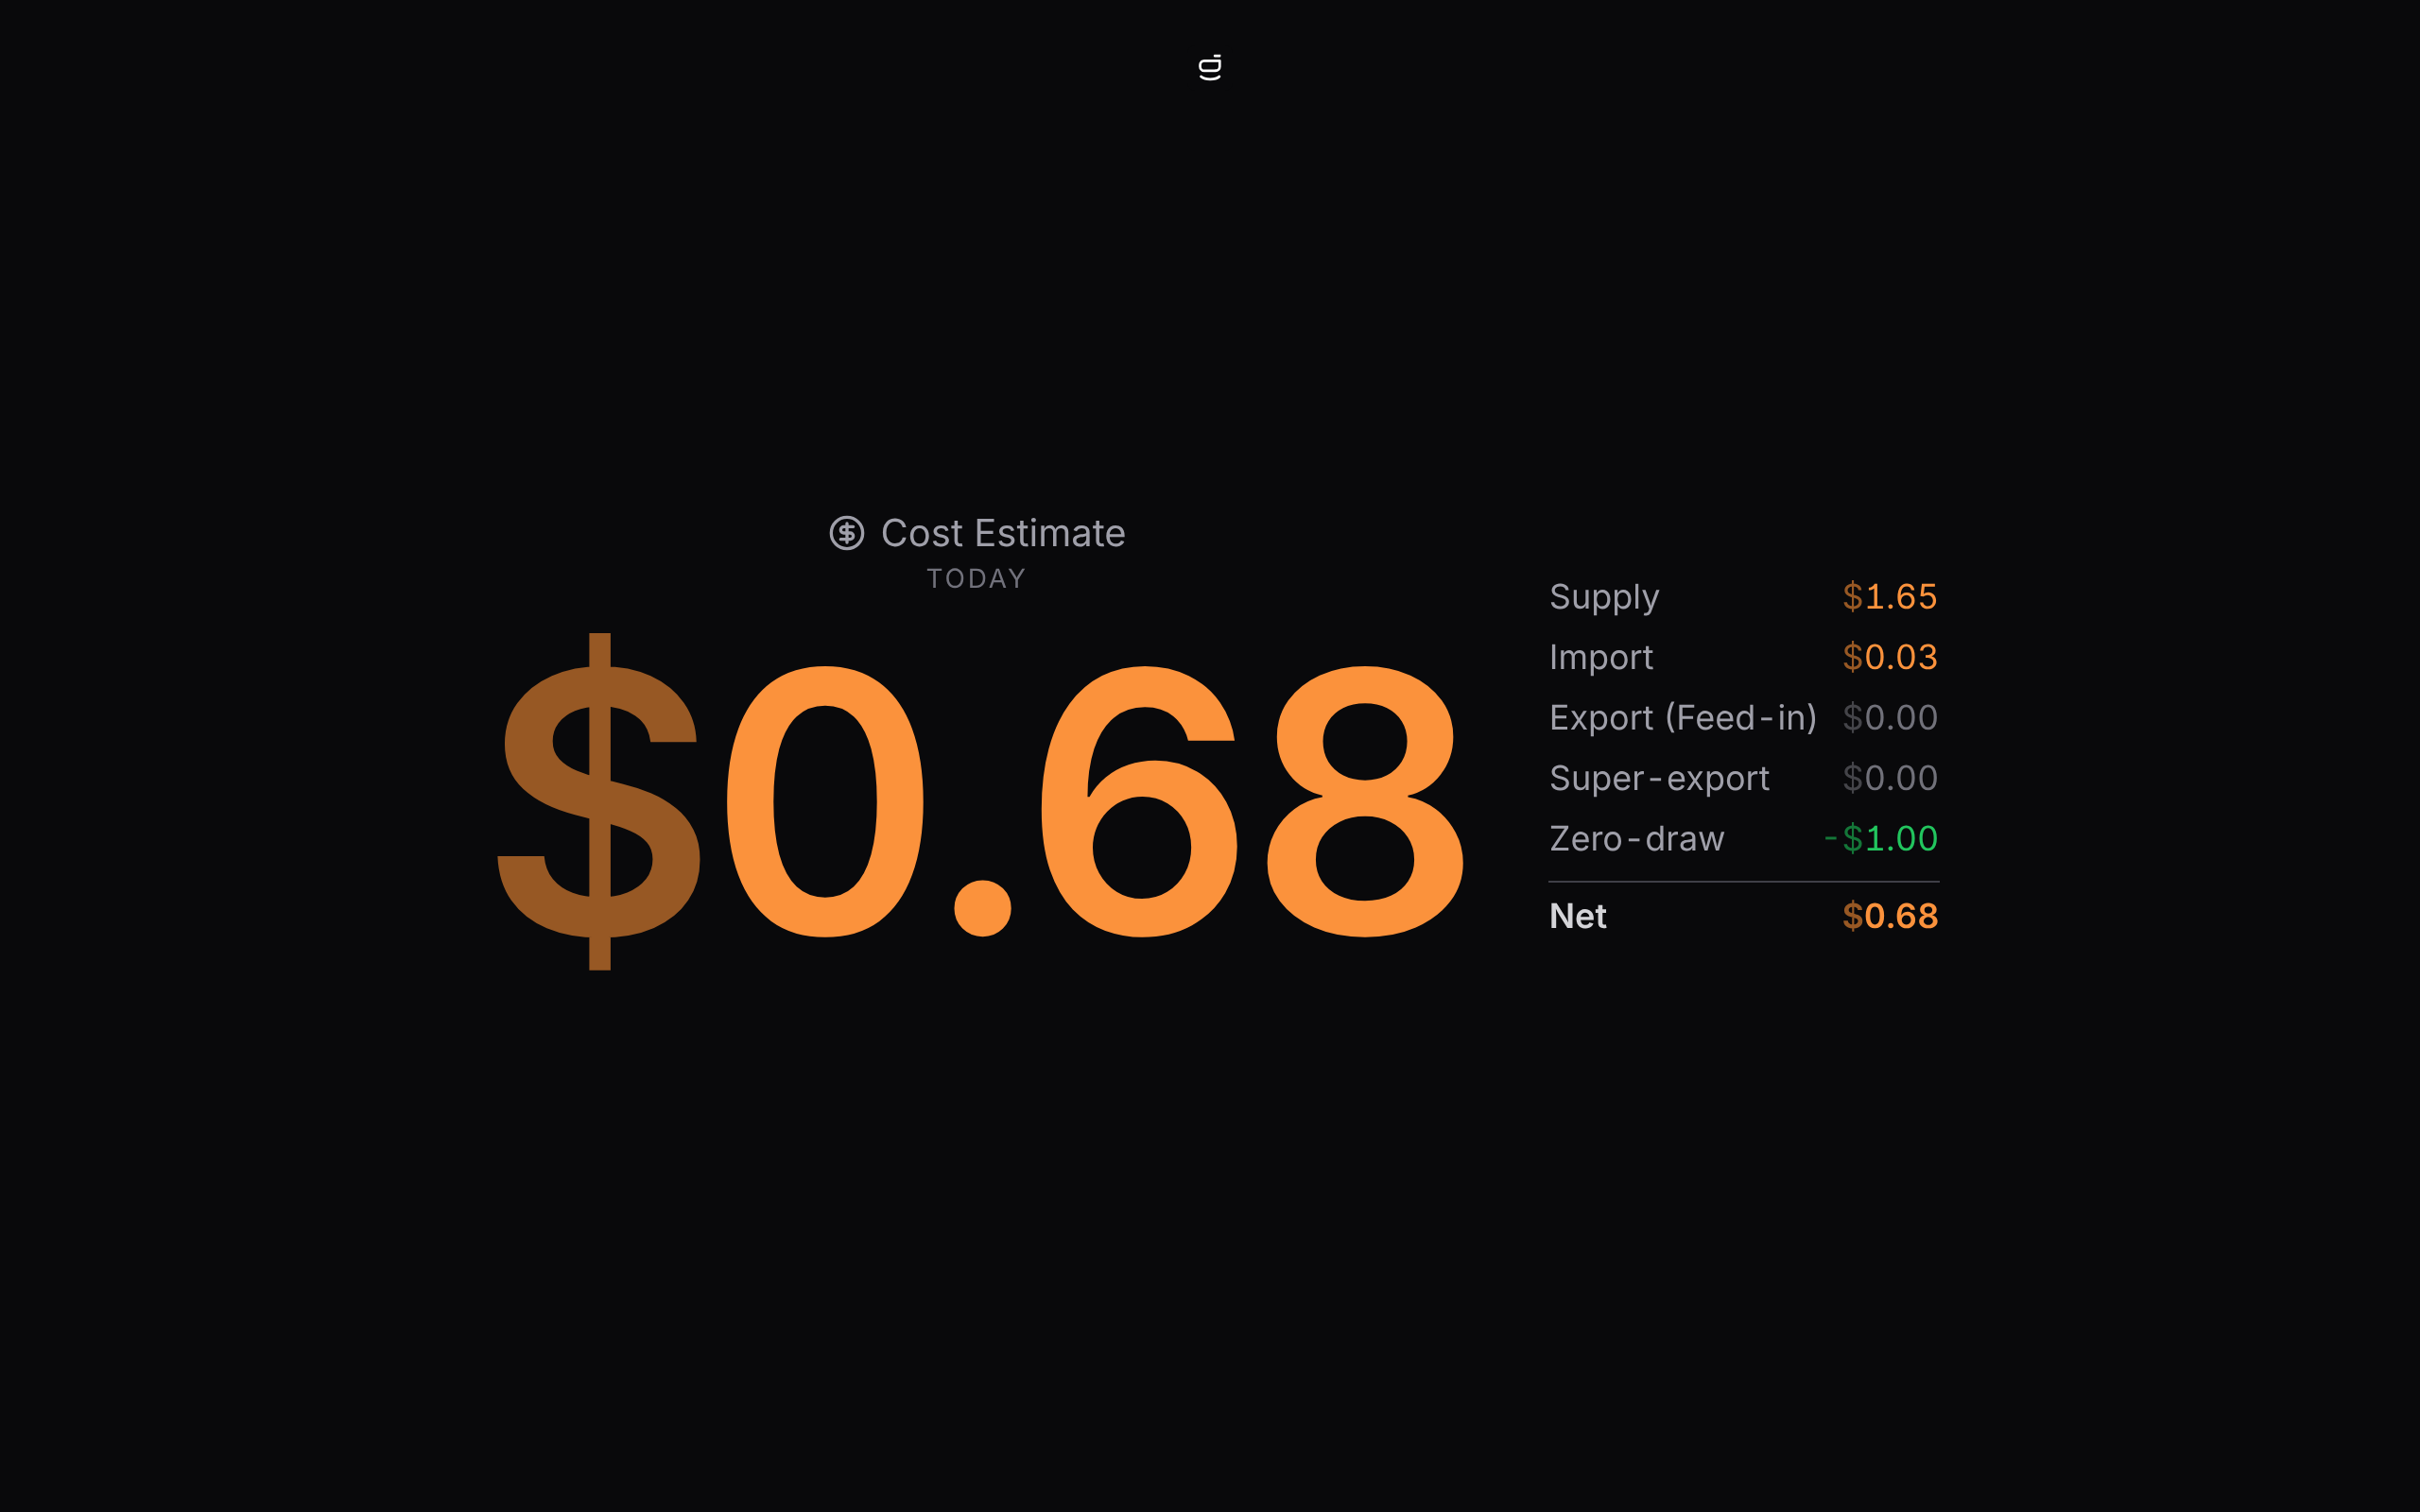
The cost figure shows either today's running net (feed-in and credits, minus import and the daily supply charge; the default) or the current per-hour rate. Tap it for the full breakdown: import, feed-in, credits, supply, and net.
A cost reads plain in orange. A credit shows a leading minus in green, because a minus means money in your favour. Both colours are yours to change in Settings → Theme.
Extra credits
It also models less-common credits some plans offer:
- A flat daily amount for drawing no grid power across a window (an evening-peak "zero-draw" reward).
- A bonus rate for the first capped kWh exported in a window each day.
An estimate, not a bill
The figures are worked out from the rates you enter and your live readings. Treat them as a guide, not something to bill or budget against.
What it can't do
The model is deliberately simple. It doesn't handle daily volume caps, demand charges, GST or rounding, tiered or seasonal rates, controlled-load circuits, or windows that shift an hour under daylight saving. If your plan has any of those, the total will drift from your bill.
Want the nitty-gritty?
How rates resolve, how the daily figure is integrated from history, and the exact fields are on the reference page: Energy tariffs.